

Stats tab
The Stats tab shows CPU, memory, disk, network and load statistics from inside the operating system. It stays empty until you install the server-monitor agent.
Install the agent
Click Install instructions and run the command it shows in a shell on the server. The installer works on any Linux distribution. The token in the command is unique to your server, so copy the line from the dialog, not from this page:
wget -N https://flux.gigahost.no/static/installer.sh && bash installer.sh <token>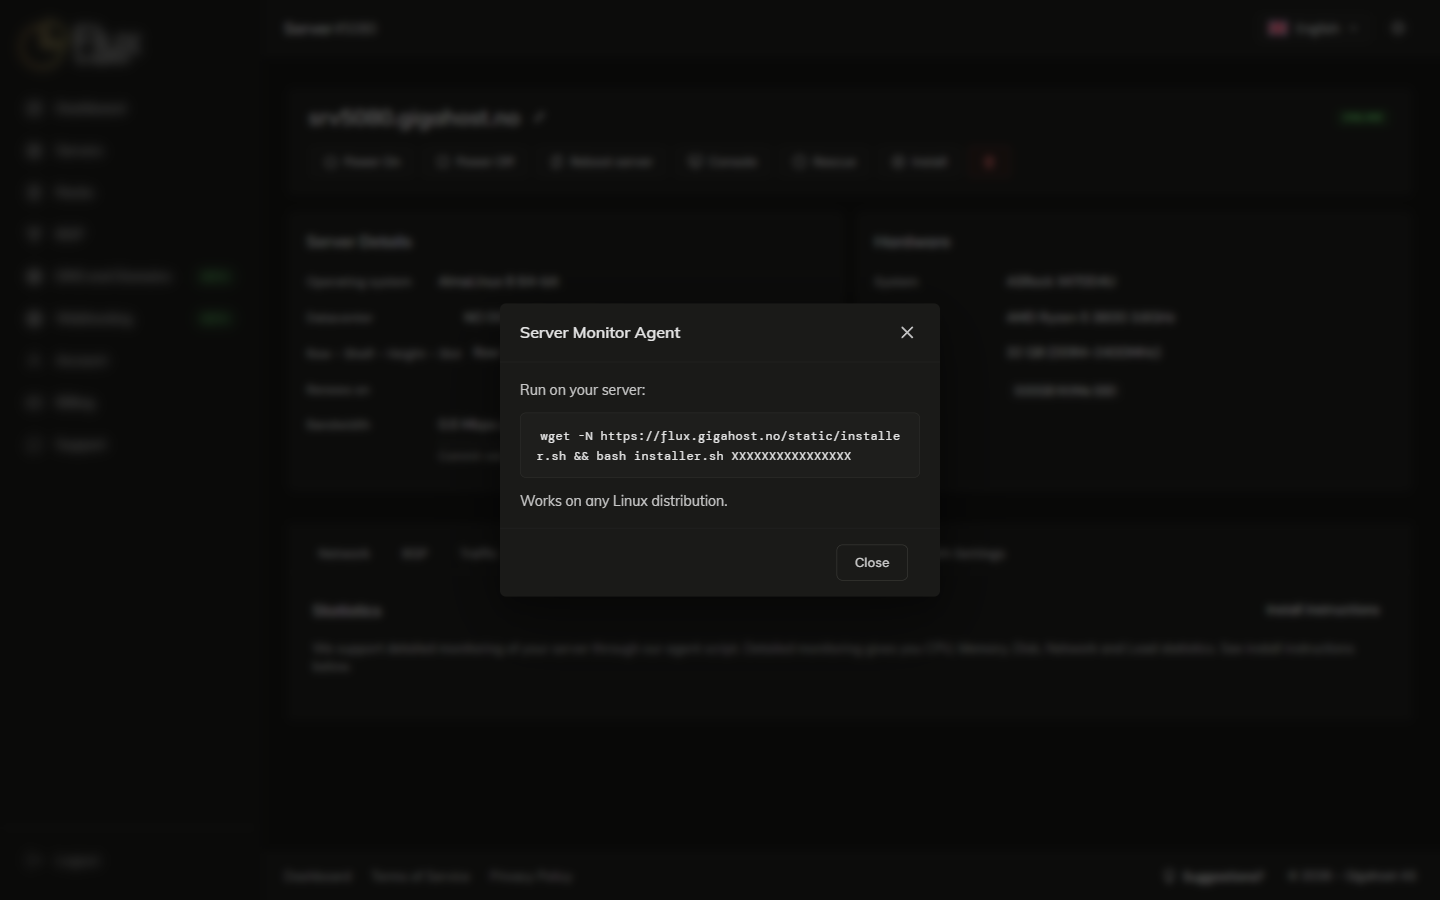
Treat the install command as a secret
The token lets the agent enrol against your account. Do not share it in public chats, screenshots or shared scripts. If it leaks, open a support ticket to have it rotated.
TIP
Run the installer over SSH rather than in the panel's Console, which can drop characters when you paste long commands.
After the agent is installed
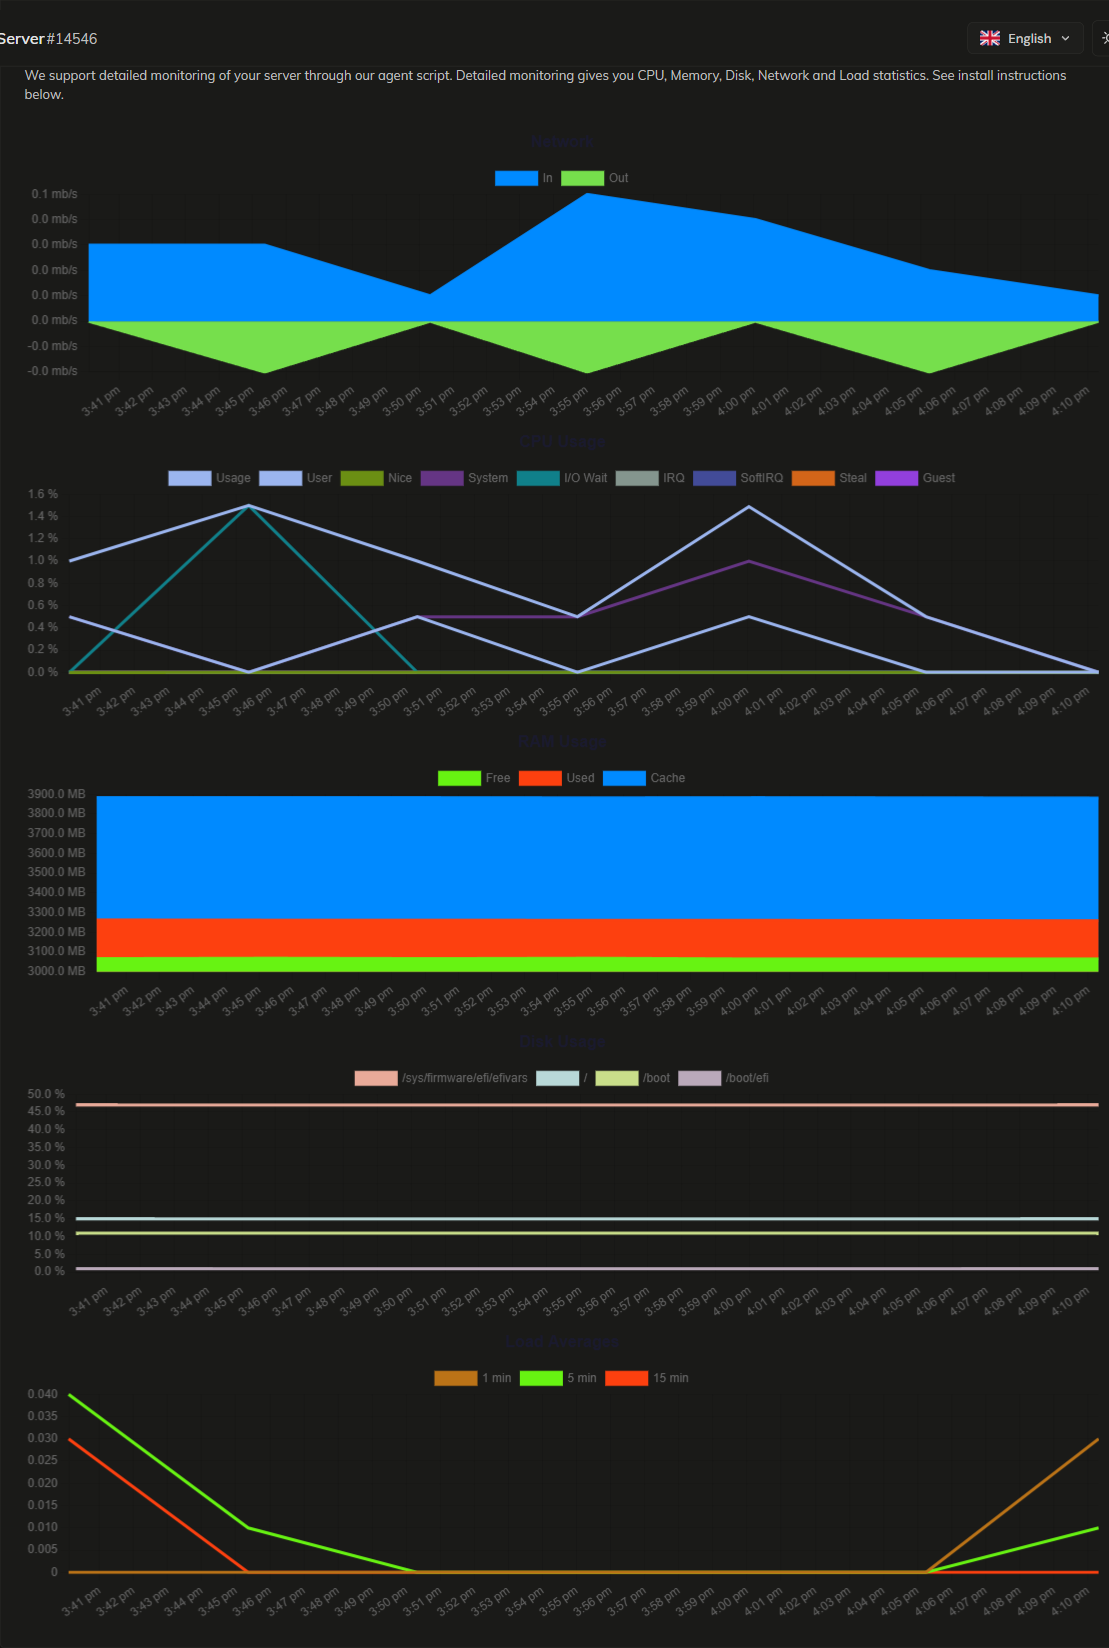
The charts cover the most recent samples. For a longer network history, use the Traffic tab.